The cinten platform

Every decision. Every stakeholder. Every minute.

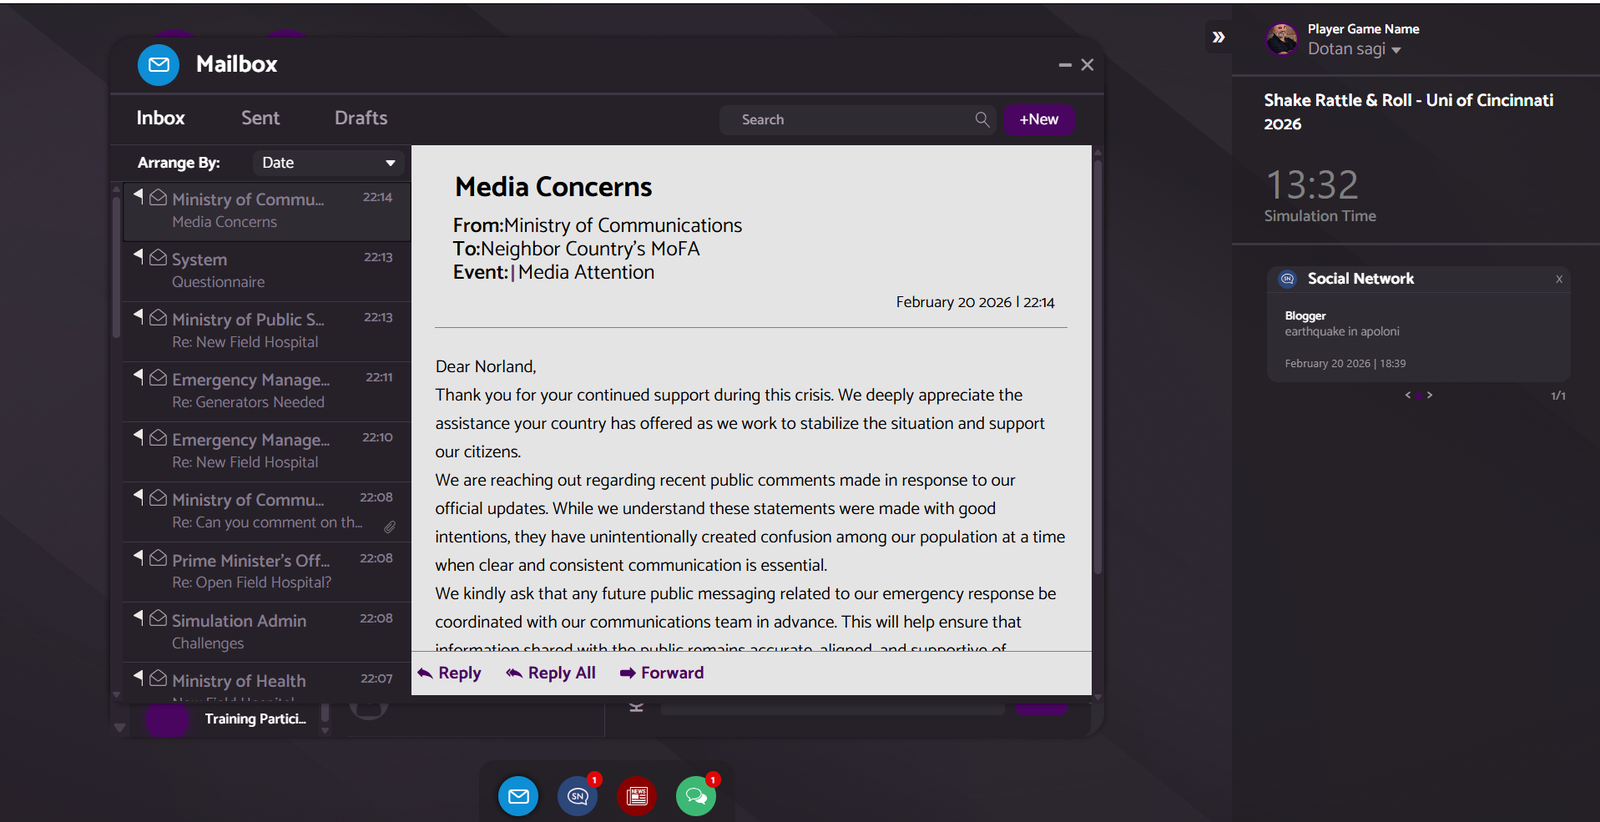
This is not an exercise. This is a record of how your organization actually behaves under pressure. Every action is captured. Every delay is visible. Every decision is traceable.

Build the situation. Not the outcome.

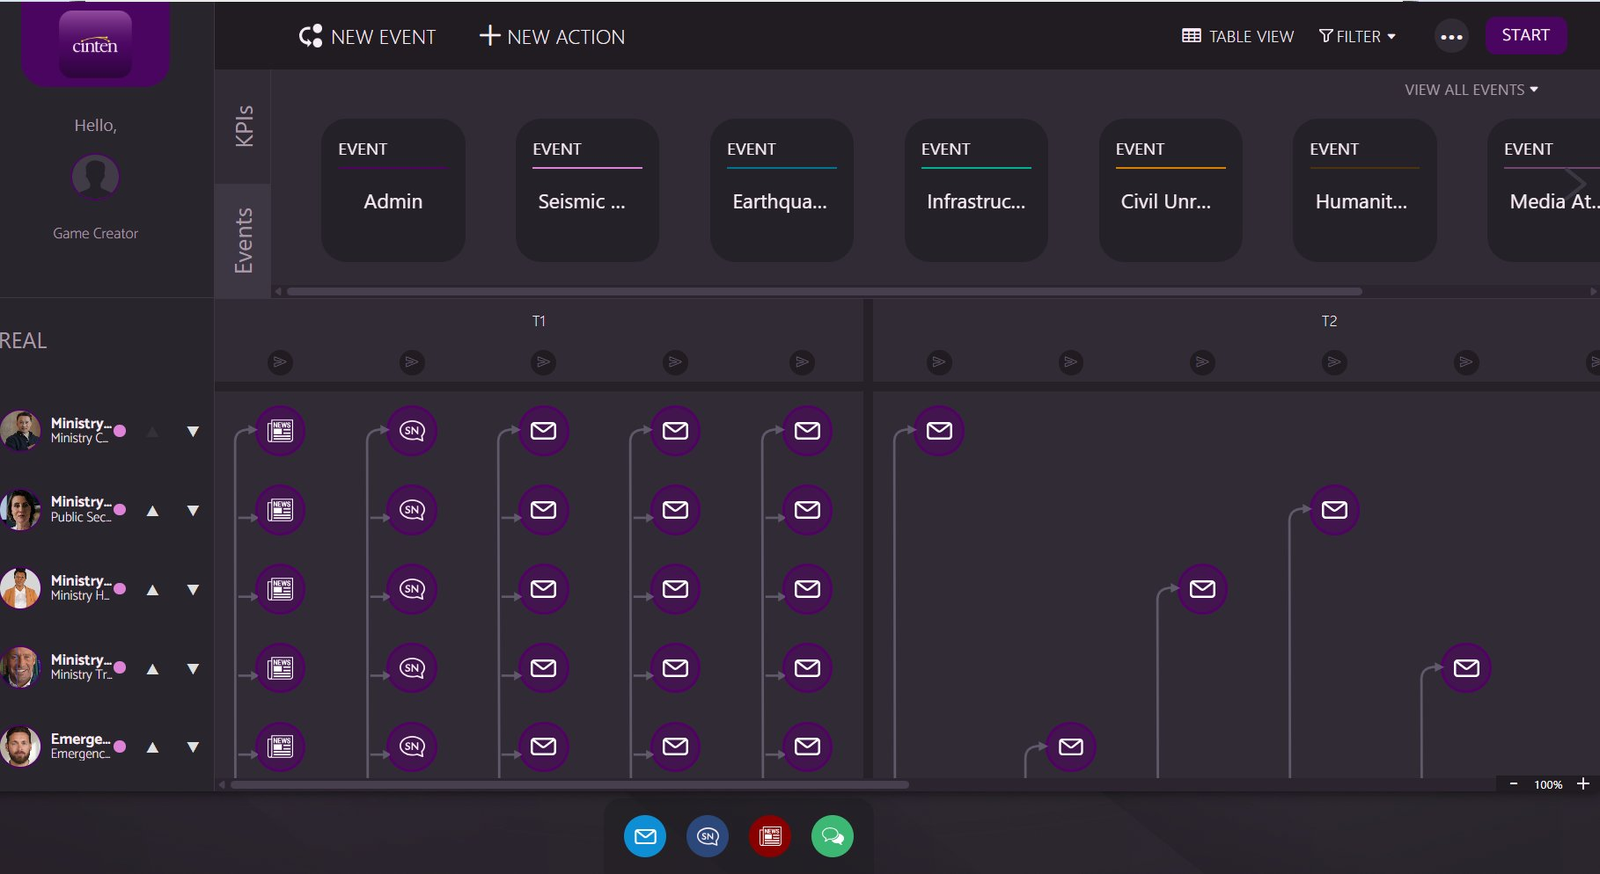
You define the structure. Events. stakeholders. timing. The system runs it the same way every time. What changes is how your team behaves.

Control surface
A working model of your organization

Each row is a role. Each column is a moment in time. You place injects where they belong. email. chat. social. decisions. The structure stays fixed. The behavior does not.

cinten scenario builder showing event timeline and stakeholder grid

Where your organization actually breaks.

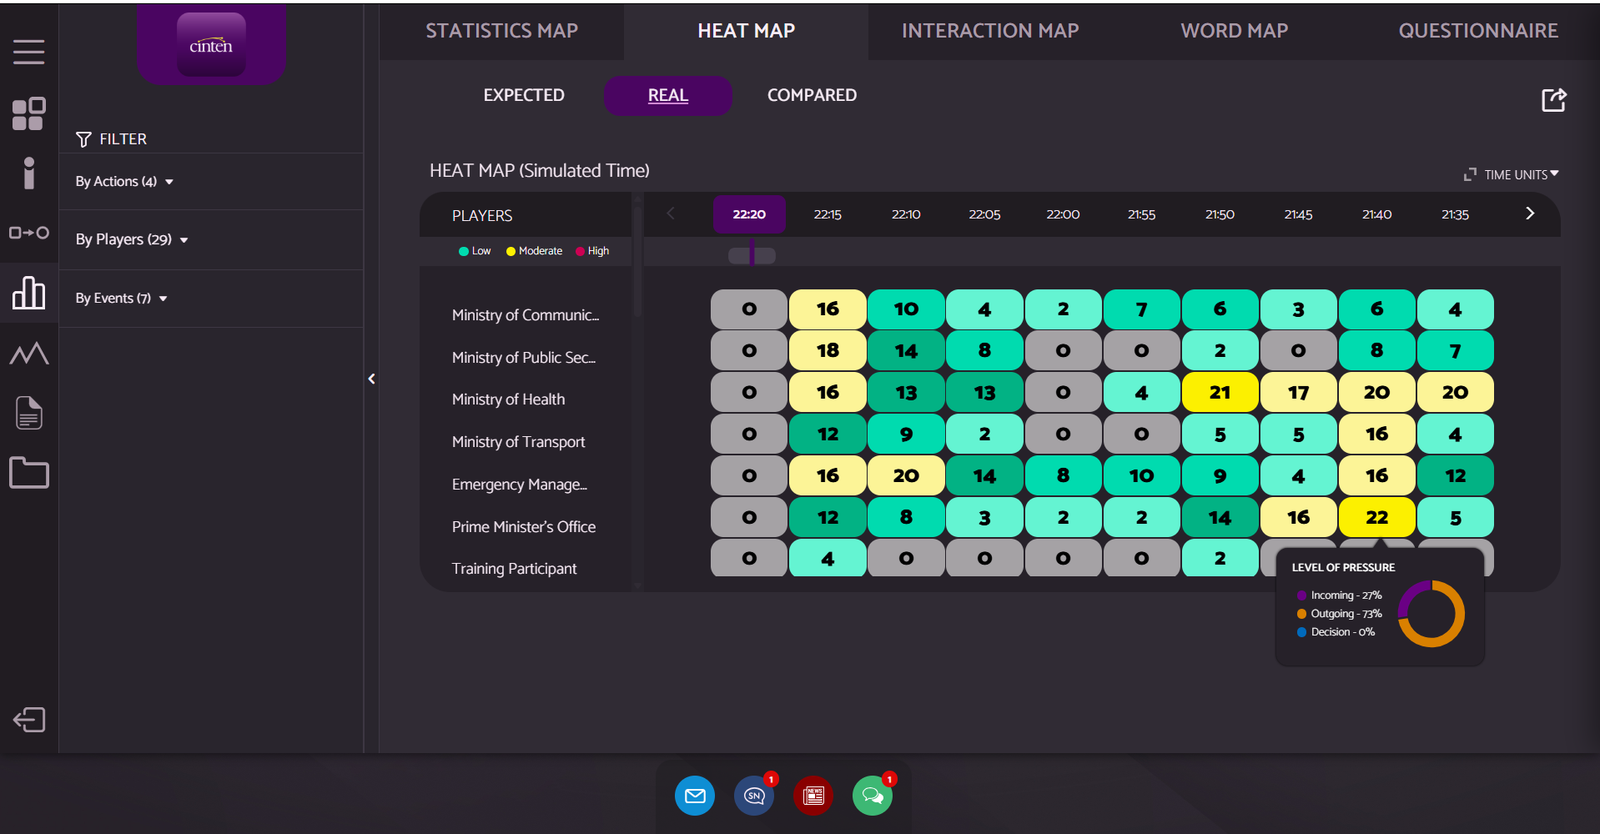
Pressure is never evenly distributed. You see exactly where it builds and exactly where it breaks.

Pressure over time
Workload per person. Per minute.

Each cell shows activity. incoming. outgoing. decisions. You see who carried the load and who stopped responding. Nothing is left to interpretation.

Heat map of decision pressure per stakeholder

The real chain of command.

Your org chart shows authority. Your behavior shows reality.

Influence, attributed
Who actually drove the situation

Every message creates a connection. Every decision creates influence. You see who people relied on, who was ignored, and who acted without alignment.

Stakeholder interaction network graph

Plan versus reality.

You already have procedures. This shows whether they were actually followed.

Plan vs. actual
Measured against your own expectations

Every action is tagged and counted. You compare what should have happened with what actually happened. The gaps are immediate.

Statistics map with action breakdown

Decisions under uncertainty.

At key moments, people must choose. Not discuss. Not delay.

Forced decisions
What people decided when it mattered

Questions are injected during the scenario. Answers are time stamped and attributed. You see hesitation, disagreement, and alignment as they happen.

Questionnaire with answer distribution

A working environment. Not a simulation.

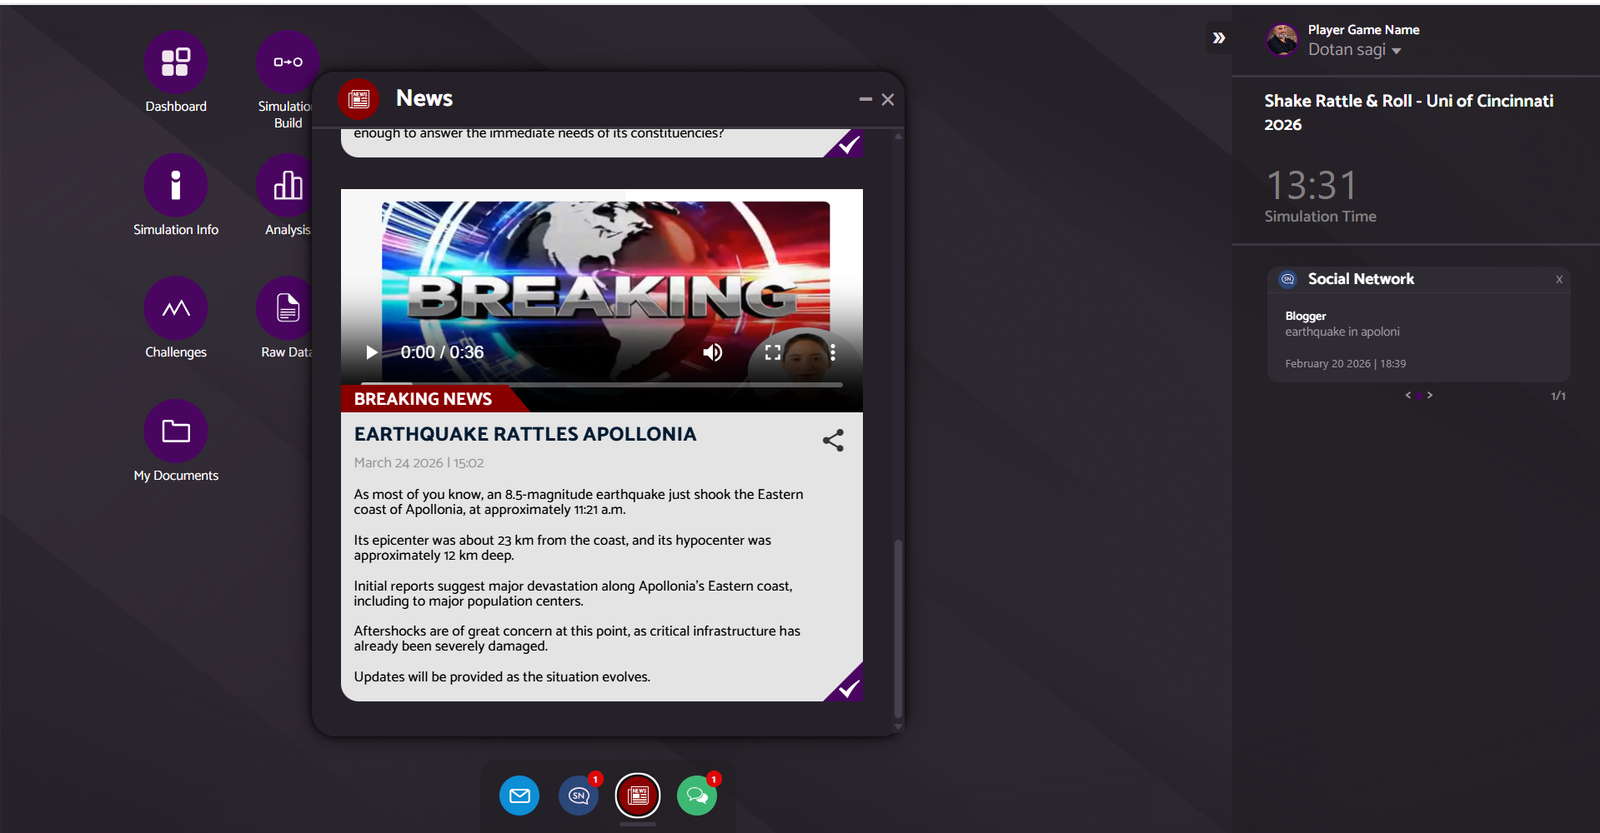
Participants operate inside the situation. They are not observing it from the outside.

Breaking news feed
Breaking news
The situation evolves whether your team reacts or not.

Headlines move. Videos air. Press statements drop. The world outside the exercise keeps going.

Mailbox with crisis correspondence
Mailbox
Decisions are communicated. Delays are visible.

Emails from stakeholders arrive with the format, tone, and urgency of real correspondence. Every response is time stamped and attributed.

Social network feed
Social network
Public pressure builds alongside operational pressure.

Teams handle public communications under the same pressure they face in a real crisis. Every post, comment, and delay is captured.

What the system does.

01 / SCENARIO BUILDER
Scenario builder

Define structure. roles. events. decisions.

02 / DEPLOYMENT
Deployment

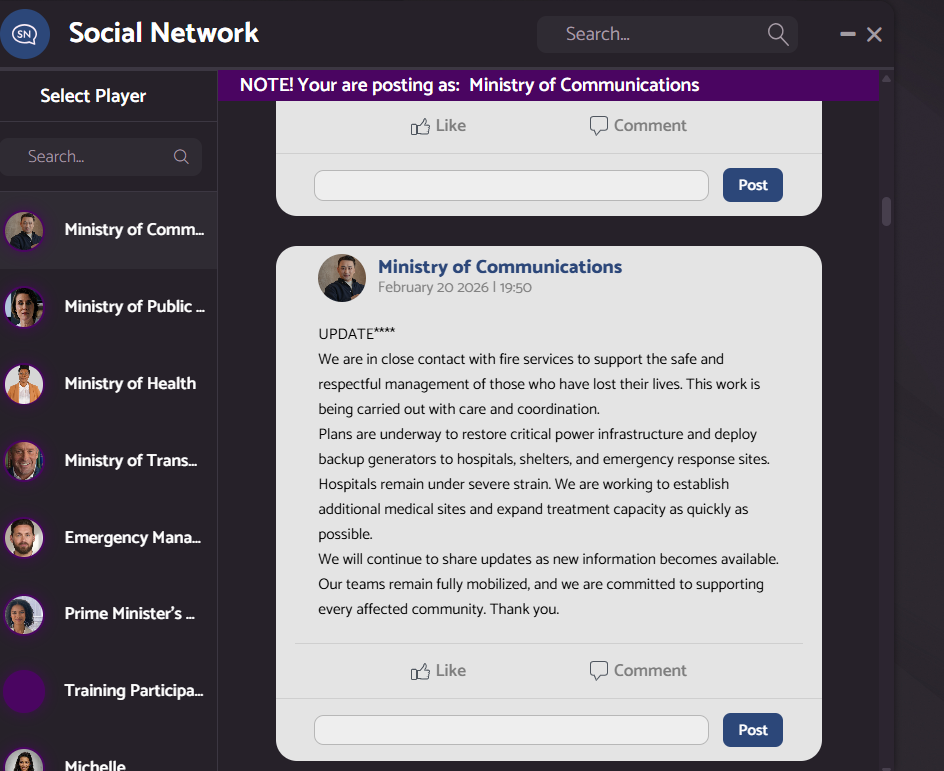
Run exercises across teams and locations.

03 / ANALYTICS
Analytics

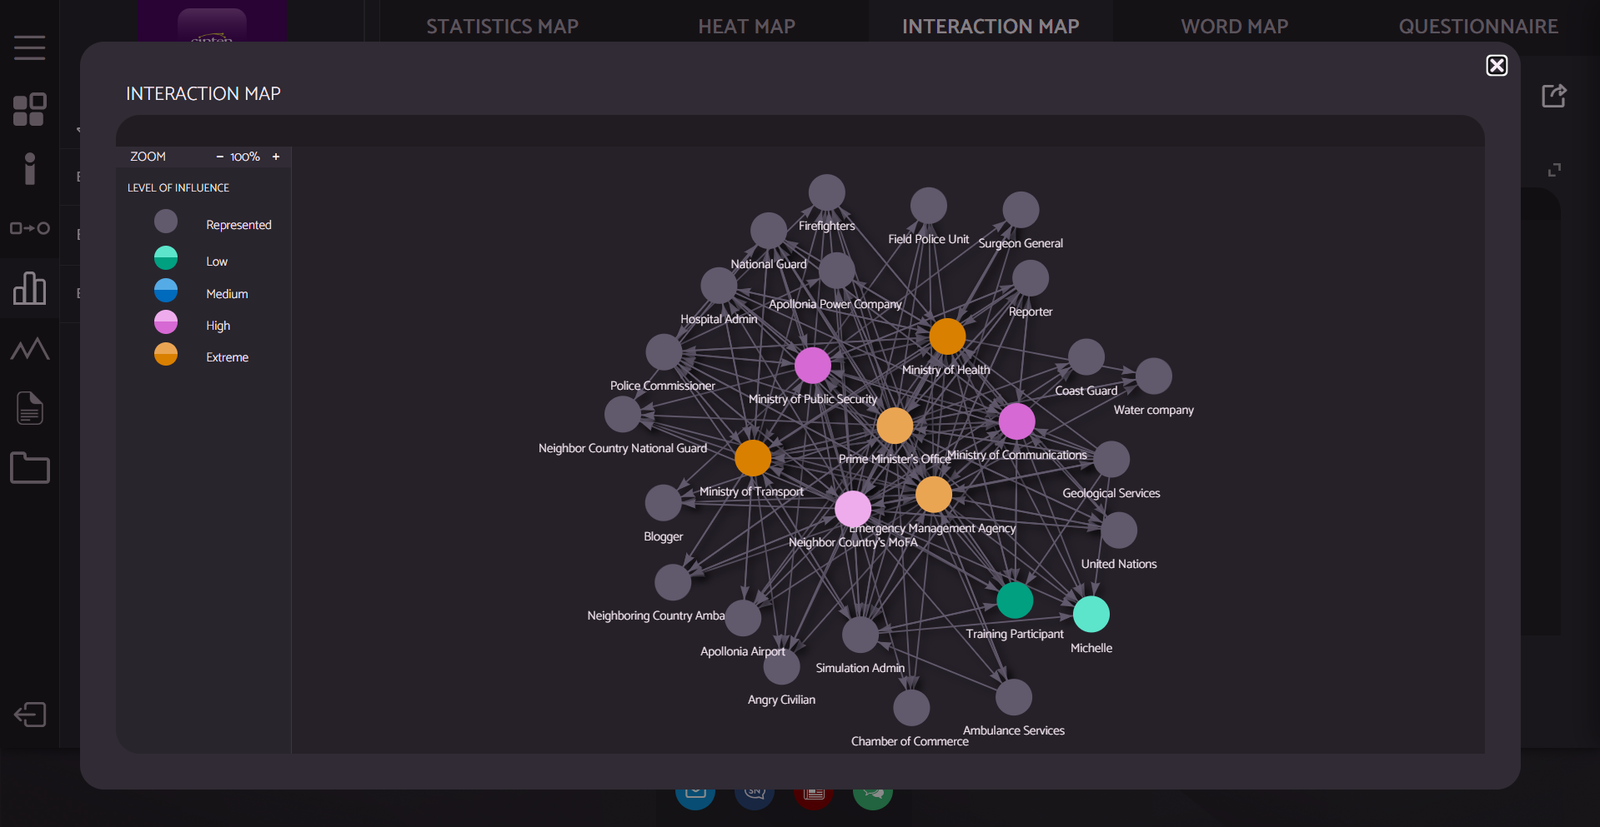
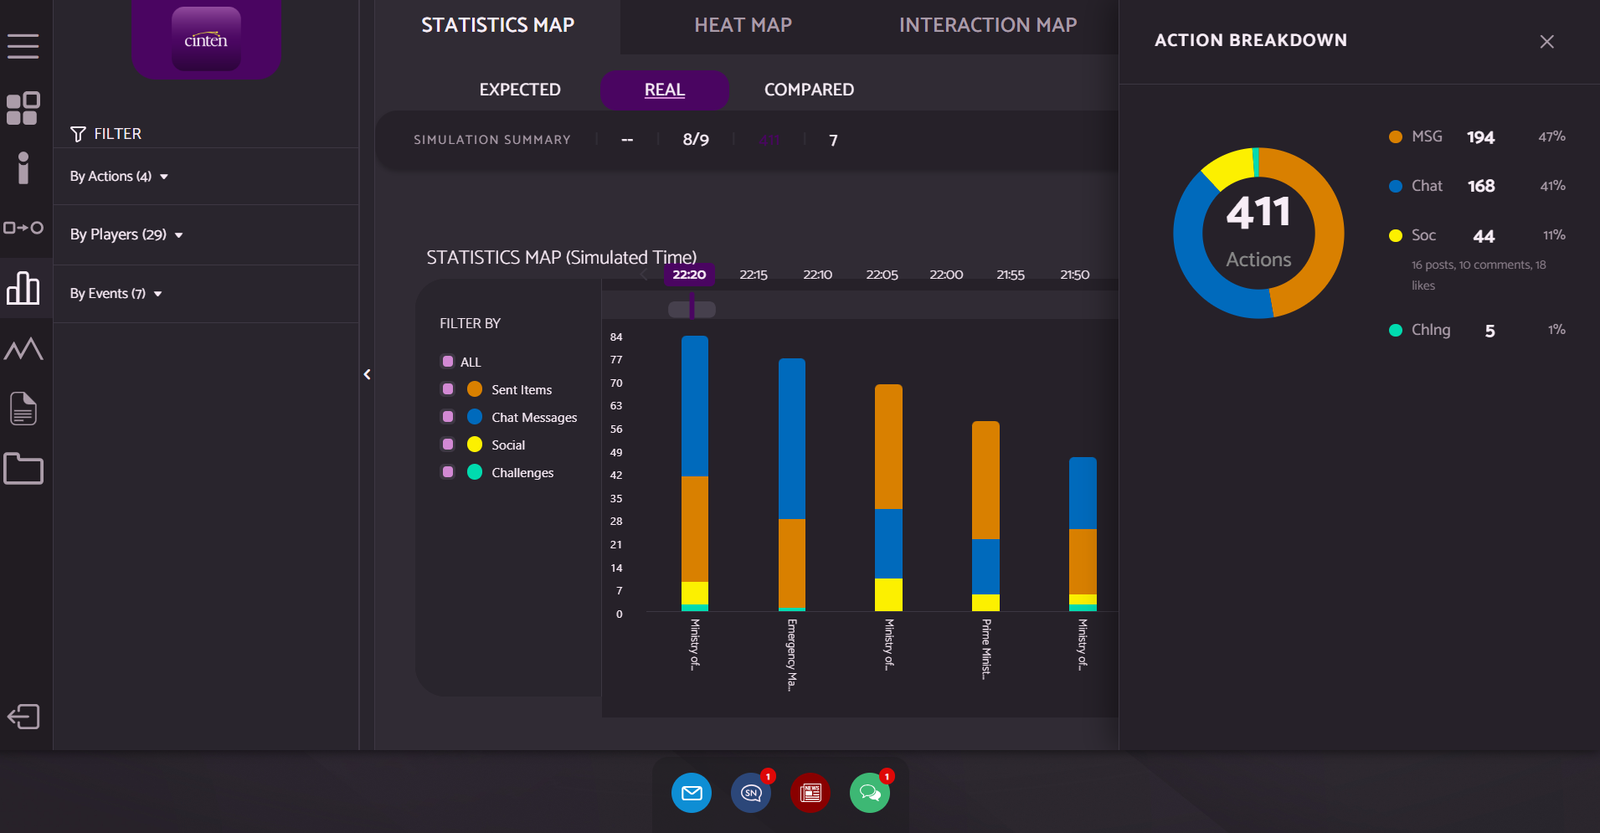
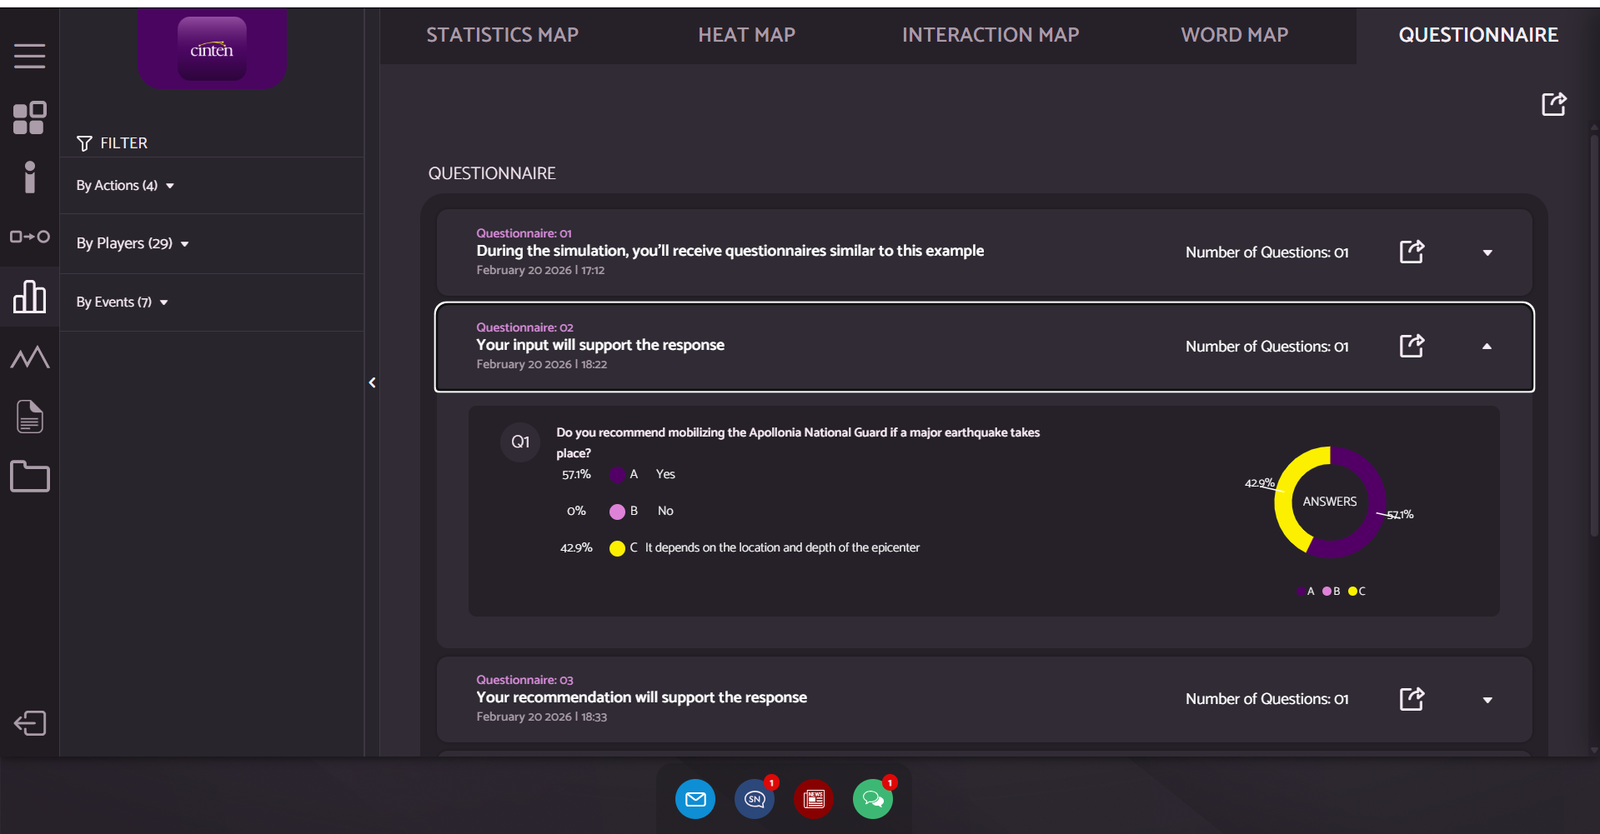
See pressure. interaction. behavior.

04 / AI INSIGHTS
AI insights

Behavior patterns. Per player. Per organization.

05 / WHITE LABEL
White label

Operate under your own brand.

06 / SUPPORT
Support

You are not running this alone.

Run your next exercise with evidence.

If you cannot prove readiness, you do not have it.